ShepWave
ShepWave Update from October 20, 20007, within the All Time High for the Dow Industrials Index..
by ShepWave.com
Posted: 9/30/2010 00:48 EST
The ShepWave Update that was published on October 20, 2007 is pasted below. This is an opportune time to post such an update.
With the markets recently rallying and the month of September seeing a very strong percentage move in the major U.S. Equity Indexes, the technicals currently being given in the markets warrant examination. Is another key top upon the U.S. Equity Markets?
ShepWave Regular Scheduled Update for Monday.
Posted: 10/20/2007 12:51:19 PM
Regular Scheduled Update for Monday Morning. Also, read notes from Friday's Intra Day Trading Update.

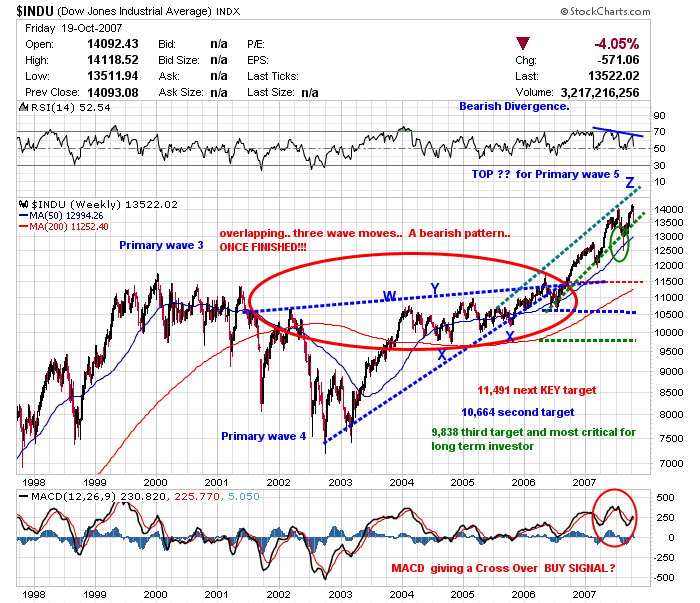
The weekly chart of the Dow Industrials Index above shows the EWT count from the top of 2000 to the low of October 2002 and the recent Fibonaccci Five Year Rally. As stated last weekend.... there is no better time to call a top. The over throw of the upper red dotted trend line is showing Bearish Divergence even on the Weekly time frame. But, we need confirmation. Notice the lows of August (green circle). The index broke below the recent trend line (of the over throw) ONCE. There was NO confirmation of a Long Term Sell signal.
This past week the Dow Indu lost over 4%. More importantly notice in the above chart that the Dow closed out the week sitting on the lower trend line of the 'over throw' rally. To give a Long Term Sell Signal.. we need a double break of this trend line with the second or following breaking bar going below the low of the first breaking bar. IF this occurs over the next few weeks then Long Term Traders should use the FIbonacci Retracement targets as potential 'Bounce' targets.....(where a bounce CAN occur).
Also we can use the 50 Period Moving Average on the Weeklly charts as our signal. But, again,, we need a double break of the trend line.

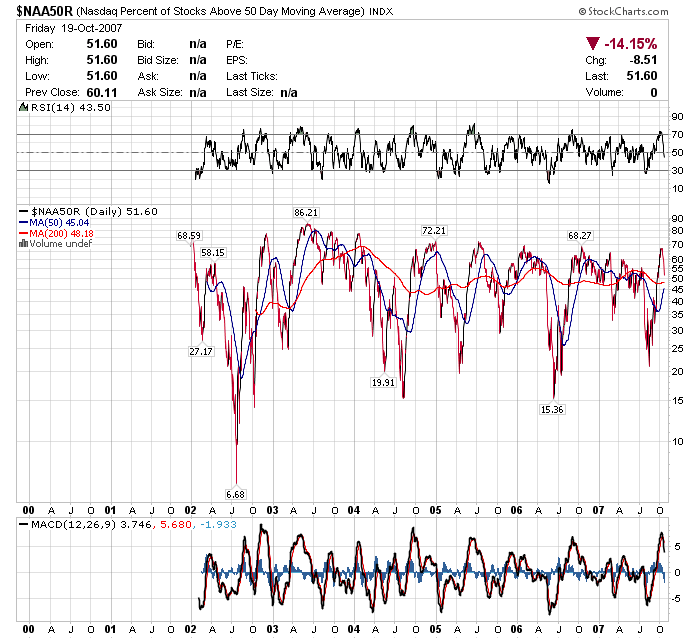
The chart above shows the Percentage of Nasdaq stocks over their 50 day moving average. Notice the sharp turn downward. A break below the 50 Day Moving Average on this chart will strengthen future Bearishness.
Remember the current 'wild card' is the Nasdaq indexes. In particular, (in my opinion), the performance of the major stocks including AAPL, RIMM and GOOG can determine whether or not the NDX (QQQQ) will hit the 38.2% Fibonacci Retracement area of the sell off from the all time highs set in 2000 to the lows of October 2002. So I will be watching these stocks very closely.
In ShepWave recent trading we have taken a big hit in our OCT PUTS for the QQQQ. This does not concern me personally. But, I have to assume that at the least 'some' of you have also taken this hit. Basically, I will be looking for Confirming SELL SIGNALS on the QQQQ and will begin buying more PUTS,,,, Probably for the months of February and March...(cautious traders can even buy them further out).
Trading Note: We could see a quick move to below the 20% area on the percentage of Nasdaq stock that are over their 50 day moving average.

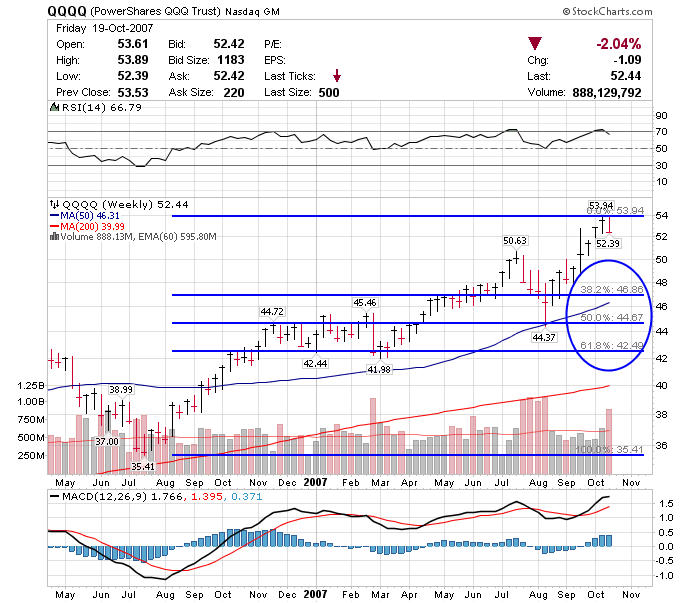
The weekly chart of the QQQQ is very important. Notice in August the QQQQ DID NOT give a SELL SIGNAL by a double break of the 50 week moving average. Long Term Traders of the QQQQ NEED a double break of this trend line for actual SELL SIGNAL. Or stop/loss for long term LONGS.
We are seeing bearish divergence on the daily and shorter term charts of the QQQQ. The targets shown in the chart above are the Fibonacci Retracement targets of the Rally from the lows of Summer 2006 to recent high. These targets could get hit very quickly. The mid to upper 40 area could be hit within a matter of days......IF we have hit the top.
Recently I have shown the long term chart for the QQQQ showing a potential UPSIDE target of the low $57 range. Do NOT count on this target being hit... Yes it is the 38.2% Fibonacci Retracement of the sell off from 2000.. but remember the rule of Elliott Wave Theory.. the first target is the wave 4 of a previous FIVE wave impulsive move... we have hit that target and gone above.. SO, minimum retracement requirements have been mit.
That is all for today. I will be lookikng to enter in to some Mid Term Options Plays this next week.
Shep
Common key words for shepwave search: qqqq, qqqq trading, qqqq analysis, qqqq quotes, nasdaq 100, elliott wave theory, qqqq options, stock market, trading stocks, qqq, trading options,dia, dia analysis, dia quotes,dia options, qqqq timing, dia timingmarket timing,dia trading
|
Reference: Shepwave.com is a technical analysis site for the Major U.S. stock indexes. We use Elliott Wave theory along with our proprietary indicators to give analysis for the Dow Industrials, Nadaq 100 and S&P 500 indexes. We specialize in trading the QQQ and DIA.
|


