Shepwave.com - www.shepwave.com
Print, and hit the Back Button - page served 7/12/2011 8:20:41 PM
ShepWave Regular Scheduled Update for Monday Part II. Weekly time frame charts for Major U. S Indices
Date Posted: 7/9/2011 2:29:21 PM
Regular Update Part II. Weekly time frame for Dow Industrials, Dow Transportations, S&P 500 and Nasdaq 100 Indices.
In this Update we have brought the time frame down to the weekly time frame. This is a process that comes in handy as a trader/investor. Know at all times what the technicals are on all time frames. Obviously if you are a day trader you would not be as concerned with the Monthly time frame or Weekly time frame. But what we are doing here is going through a process that all traders should follow.
.png)
Read the notes in the above weekly chart for the Dow Industrials index. The main points are (1) we saw clear bearish divergence at the recent high set in late 2007, (2) we see a clear five wave impulsive (non-overlapping, meaning wave 4 does not over lap wave 1) action, (3) the rally from the lows of wave 1 down in 2009 could also be labeled by Elliott Wave Theory in many ways. I have it as a three wave (A,B,C) move, but in defense of the BULLISH view this could actually be a renewed rally leading to new all time highs, but that is not the preferred view point at this time. But it is something that anyone who is a Perma-Bear needs to keep in the back of his mind.
Also important to note is that since the move downward from the top of 2007 to the lows of 2009 was a clear five wave impulsive (non-overlaping) move strengthens either of the other bearish views.
Also the fact that the 200 month moving average was broken in 2009 also strengthens the bearish view. This is important in my opinion and should be a note of caution to any one who is an investor.
One more important factor is the we have a bearish CROSS OVER on the MACD.
These are all factors to consider when doing chart work.
This is where watching the action on shorter and longer term time frames is necessary. Note the 11,258 area. A SINGLE break of this area would greatly diminish the more bullish view that the index is going to a new all time high.


Here is where doing charting analysis gets fun.
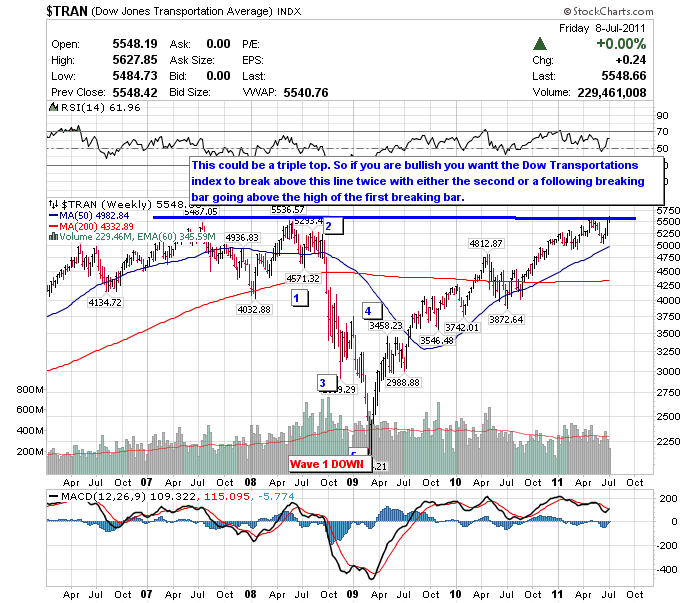
Read the notes in the above chart.
Note that the all time high was set in 2008, not in 2007 like the Dow Industrials and S&P 500 Indexes.
For the Dow Theory to work out here we would have to see the Dow Transportations and Industrials Indexes break to new all time highs. The Dow Industrials index is still just over a thousand points from doing that. This is definitely a bullish wild card for the major Indexes, all except the Nasdaq Indexes, that is. That is my opinion. But this shows the importance of the current action.
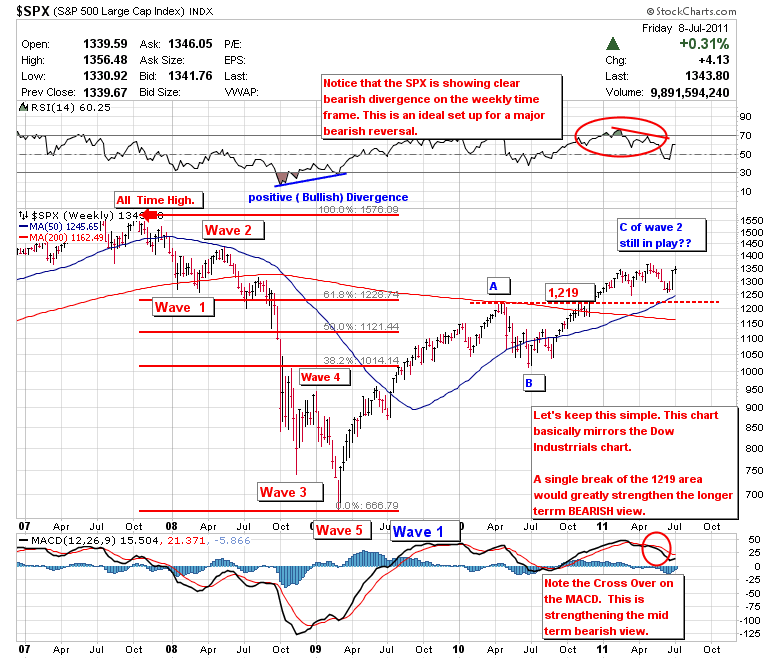
Keep in mind I am bearish, I am not a perma-bear. The recent economic and unemployment data are not currently supporting the bullish view.

Let's make this one simple too.
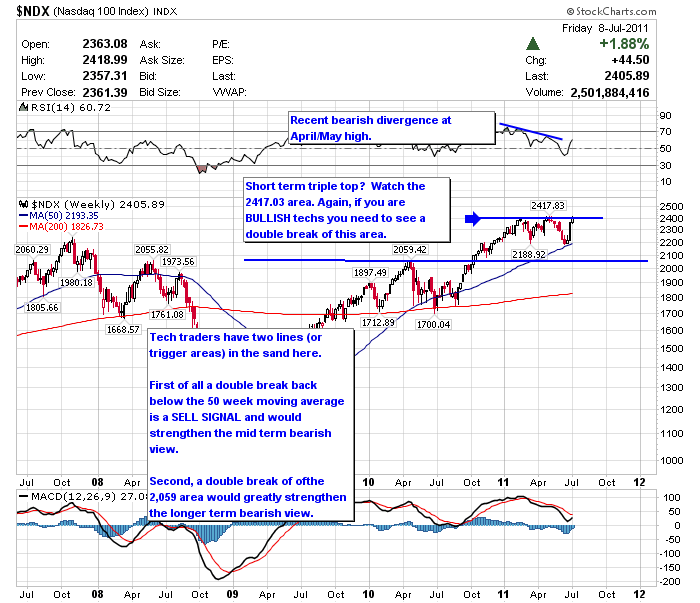
Read the notes in the weekly chart of the Nasdaq 100 Index (NDX).
One important technical factor is that the NDX is making higher highs than it saw in 2007 or 2008 (cf. charts of the Dow Indu and Dow Trans above).
Remember the Nasdaq Indexes werre not in existance when the Dow Theory was popularized in the 1960's.
If you are an investor and are long the TECH stocks, you want to see new higher highs. Next week begins earnings announcements and is going to be a very iimportant technical week.
If you are long TECHS (NDX) you want to pay special attention to the 50 week moving average of the NDX. A double break of this mark would greatly strengthen the mid to longer trerm bearish view.
This could be another bullish wildcard. But again, I do not hold that view at this time. Who knows maybe the Nasdaq 'will' hit 10,000 as they were screaming on CNBC back in 2000.
One final note of importance is that all of these indices have bearish cross-overs of the MACD on the weekly time frame. But, they are turning up. If they make an upward crossover then the bullish view would indeed be strengthened. So, be careful and watch the trigger and target areas very carefully.
In closing this report, keep in mind that the next full moon is Friday, July 15, 2011. Hey do not laugh, it is remarkable how key tops coincide with full moon appearances. Also it is Options Expiration for July.
Shep
| 
.png)


