Shepwave.com - www.shepwave.com
Print, and hit the Back Button - page served 10/9/2008 11:57:38 PM
ShepWave Regular Scheduled Update for Monday. Outside Down Week in the Dow Indu, Dow Trans, NDX, and SPX.
Date Posted: 5/26/2008 1:46:36 AM
Regular Scheduled Update for Monday.
Markets are closed Monday for Memorial Day. Enjoy the holiday.
.png)
Let's take a look at the Daily chart for the VIX (Volatiilty Index). Notice we have broken the down trend line (shown in blue) caused by the recent (Wave 2 ?) Rally in the indexes. A break above last Friday's high of 19.80 would be a double break of the trend line with a following breaking bar going above the high of the first breaking bar. This would greatly strengthen that we are back to the mid to longer term Bearish Trend and that our initial Mid Term target is to break below the Lows of March.
We may be able to use the VIX as a possible indicator to find a LONG SIDE entry for the Mid term trend later. But, IF we are in a wave 3 down then an Exhasution Gap down (a gap which is not filled) could be in the cards for the several next few days (weeks).

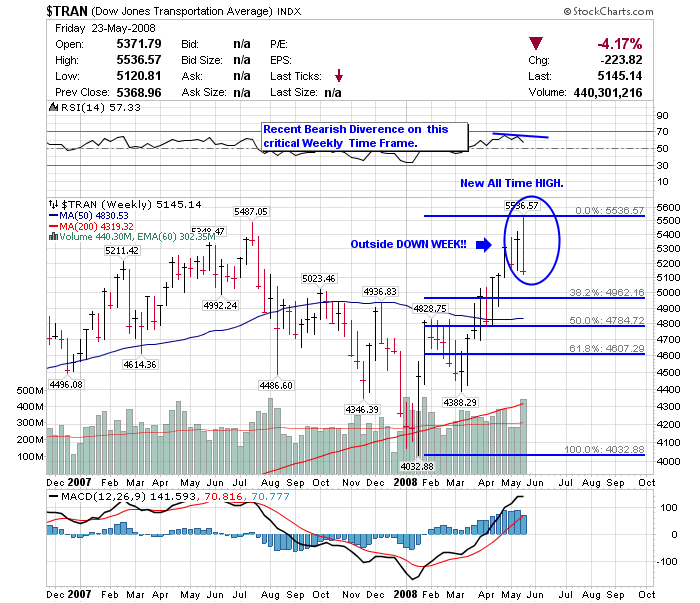
The weekly chart of the Dow Transportation Index is very important no matter what your are trading and regardless of time frame. Notice we saw recent bearish divergence when the index hit a new all time high last week. We also saw a quick reversal from this area.
VERY IMPORTANT: the Dow Transportation index had an Outside Down week last week. An O.D. week is a week which goes higher than the previous week BUT CLOSES lower then the previous week's low. This could be critical and in the past has been an indication of several weeks of bearish action ahead. I will be watching the Dow Transportation index for clear impulsive Downward movement to strengthen the Bearish View.
.png)
The weekly chart of the Dow Industrials index above shows that the index also had an Outside Down Week. This is usually a reliable signal to stay SHORT for the Mid Term (or at least until we hit a new recent low to the low set in March.

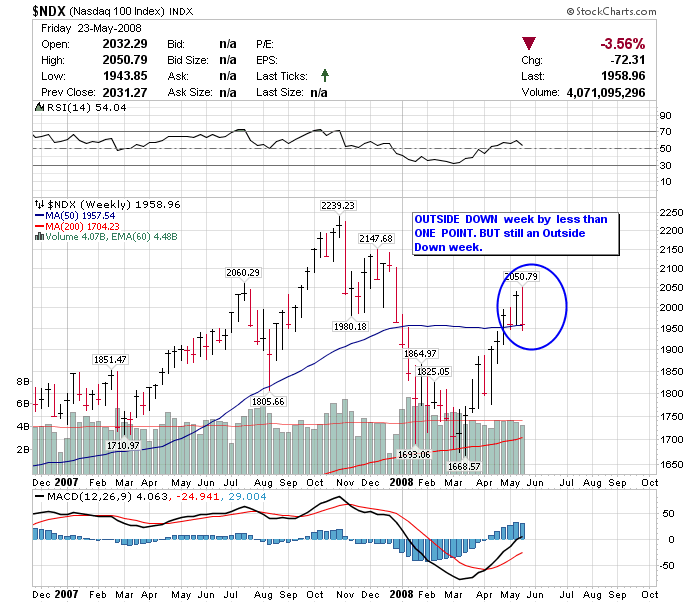
The Nasdaq 100 Index also had an Outside Down week as indicated by the Weekly chart of the NDX above. Granted it closed Less than ONE POINT below the low of the previous week.. but nontheless it is a low which is LOWER than the previous week.
Also, a break below last week's low of 1943 would be a Double Break back below the 200 Week Moving Average.. again strengthening the Bearish Mid Term View.
The S&P 500 Index also had an Outside Down Week. I will be watching for follow through to the downside for the indexes in am 'Impulsive' fashion. There may be some Short Term BUYING OPPORTUNITIES. I will show some trigger trend lines ansd guidelines for this potential in the Pre-Market Update for Tuesday. BUT use caution in ALL LONG SIDE positions. Any surprises should come to the downside.
That is all for tonight. Enjoy the rest of your weekend and get rested up for next week. I plan on entering some new positions ASAP.
Shep
229 | 
.png)

.png)


