|
Below is a copy and pasted version of the ShepWave Update published on October 11,2007.
Shepwave.com - www.shepwave.com
Print, and hit the Back Button - page served 10/6/2008 2:32:14 PM
ShepWave Regular Scheduled Update for Thursday.
Date Posted: 10/11/2007 12:33:54 AM
In tonight's Regular Scheduled Update for Thursday Morning I show some key technicals and possibilities of the continued Bull Market. I have emailed tonight's update to all of those on the ShepWave Email list.
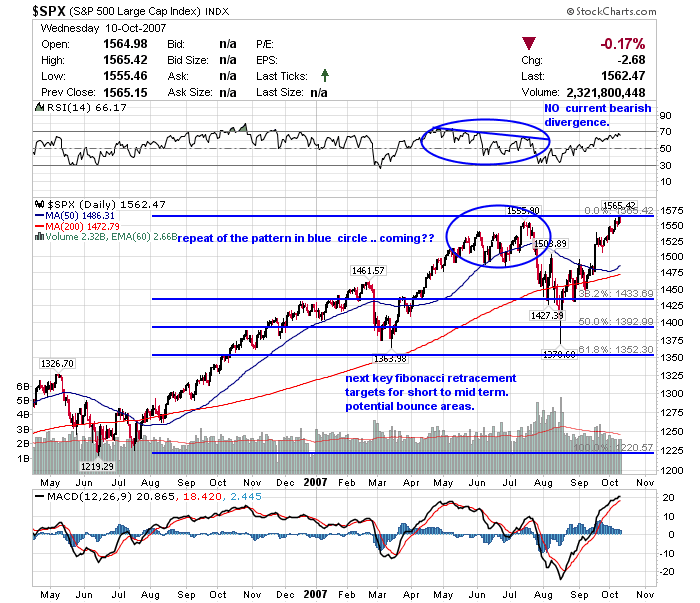
The daily chart of the S&P 500 Index shows an ideal set up for a dip to be followed by a new all time high. Notice when we saw the top in July that the index had created Bearish Divergence on the Daily time frame before taking the big move down. Notice the RSI and MACD are both showing potentially over bought short term indications. As shown in the Intra Day Update we are seeing bearish divergence on ALL the indexes on 30 minute time frame. We are also seeing recent bearish divergence on 60 minute charts. This supports the mid to longer term BULLISH argument that we could have a quick sell off followed by new highs in all the indexes.
The problem here is that it seems too clean. When it seems to good to be true it usually is; even with technical analysis. We have to look at the bigger picture. The recent rally has lasted a Fibonaccci 5 years. This 'would' be an ideal time for the rally to end. Economically speaking there is a multitude of reasons that could cause a sell off... regardless of what the recent technicals are telling us. As shown in recent updates; we have the fact that the Dow Transportations index is NOT confirming the recent new highs. The Transportations index is still 10% below its all time high set in July. Now, it has occurred in the past (just last year) that the Transportations index was a lagging indicator.. so don't rely too heavily on this indication either.
The bottom line is this: we have plenty of recent bearish divergence. But, until the recent up trend is confirmed to be broken.. the trend is UP. See the notes in the Intra Day updates for mid term trend lines that need to be broken to strengthen a Reversal.
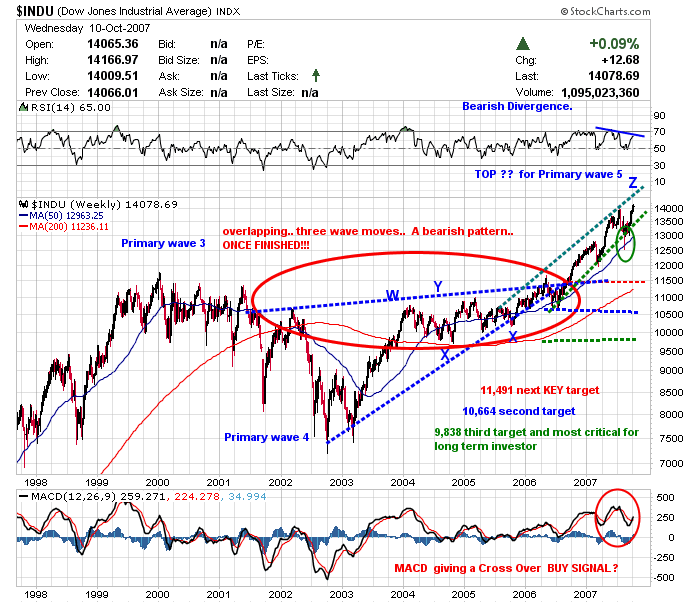
The weekly chart of the Dow Industrials Index above shows the action from the highs set in 2000 to the recent lows set in October 2002 (a Fibonacci 5 Years ago) and the rally from the lows. Notice we have a possible ending diagonal pattern from the lows of October 2002. This is ultimately a bearish pattern.. ONCE CONFIRMED to be broken.
In August the index broke the recent trend channel of the 'over throw' upward move. But, there was no second break to confirm the longer term SELL SIGNAL. (see green circle area). We need to see a double break of the green dotted trend line or a double break of the 50 week moving average to strengthen that the mid to longer term trend has turned down. That is the BULLISH argument.
The key targets shown in the chart above are the Fibonacci Retracement targets for potential bounce areas. Once a top is confirmed to be in. Assuming that we have hit a key top these targets, if broken, increase Bearish Potential for the Longer term. The most critical target for Long Term Investors is the 9,838 area. IF this area is broken Long Term Investors 'could' be in for a long hard road.
The Bearish argument is that we are seeing clear recent Bearish Divergence...so, this is the first part of the set up for a reversal. See the Intra Day Update for the analysis of the recent analysis from the lows of August 16. Notice the indexes have been trading in a increasingly 'tighter' trend channel. I expect this trend channel to be broken soon. The question remains as to whether it will break out of the channel and create a new Up Trend Channel or break below the channel creating a set up for a longer term Bearish Signal.
In past updates I have shown the potential upside target for the QQQQ to go to the $57.39 area. (the QQQQ can be used as a proxy for the NDX). The $57.39 area would be a 38.2% Fibonacci Retracement of the sell off from all time highs to the lows of October 2002. The current trend is UP... but, look at the trend channels shown in the Intra Day update for the clear bearish divergence on many time frames and the target trend lines to signal a reversal.
That is all for today. Short one tonight. Continue to watch the Intra Day Updates closely. Especially the 30 minute charts of the QQQQ, Dow Indu and S&P 500. Remember 'Price Dictates'. Regardless of the obvious bearish divergence.. we must see a clear break of key trend lines to signal a reversal. It would not be surprising to see a quick drop once we do see the expected key top.
Shep
639 | 


